 Solution
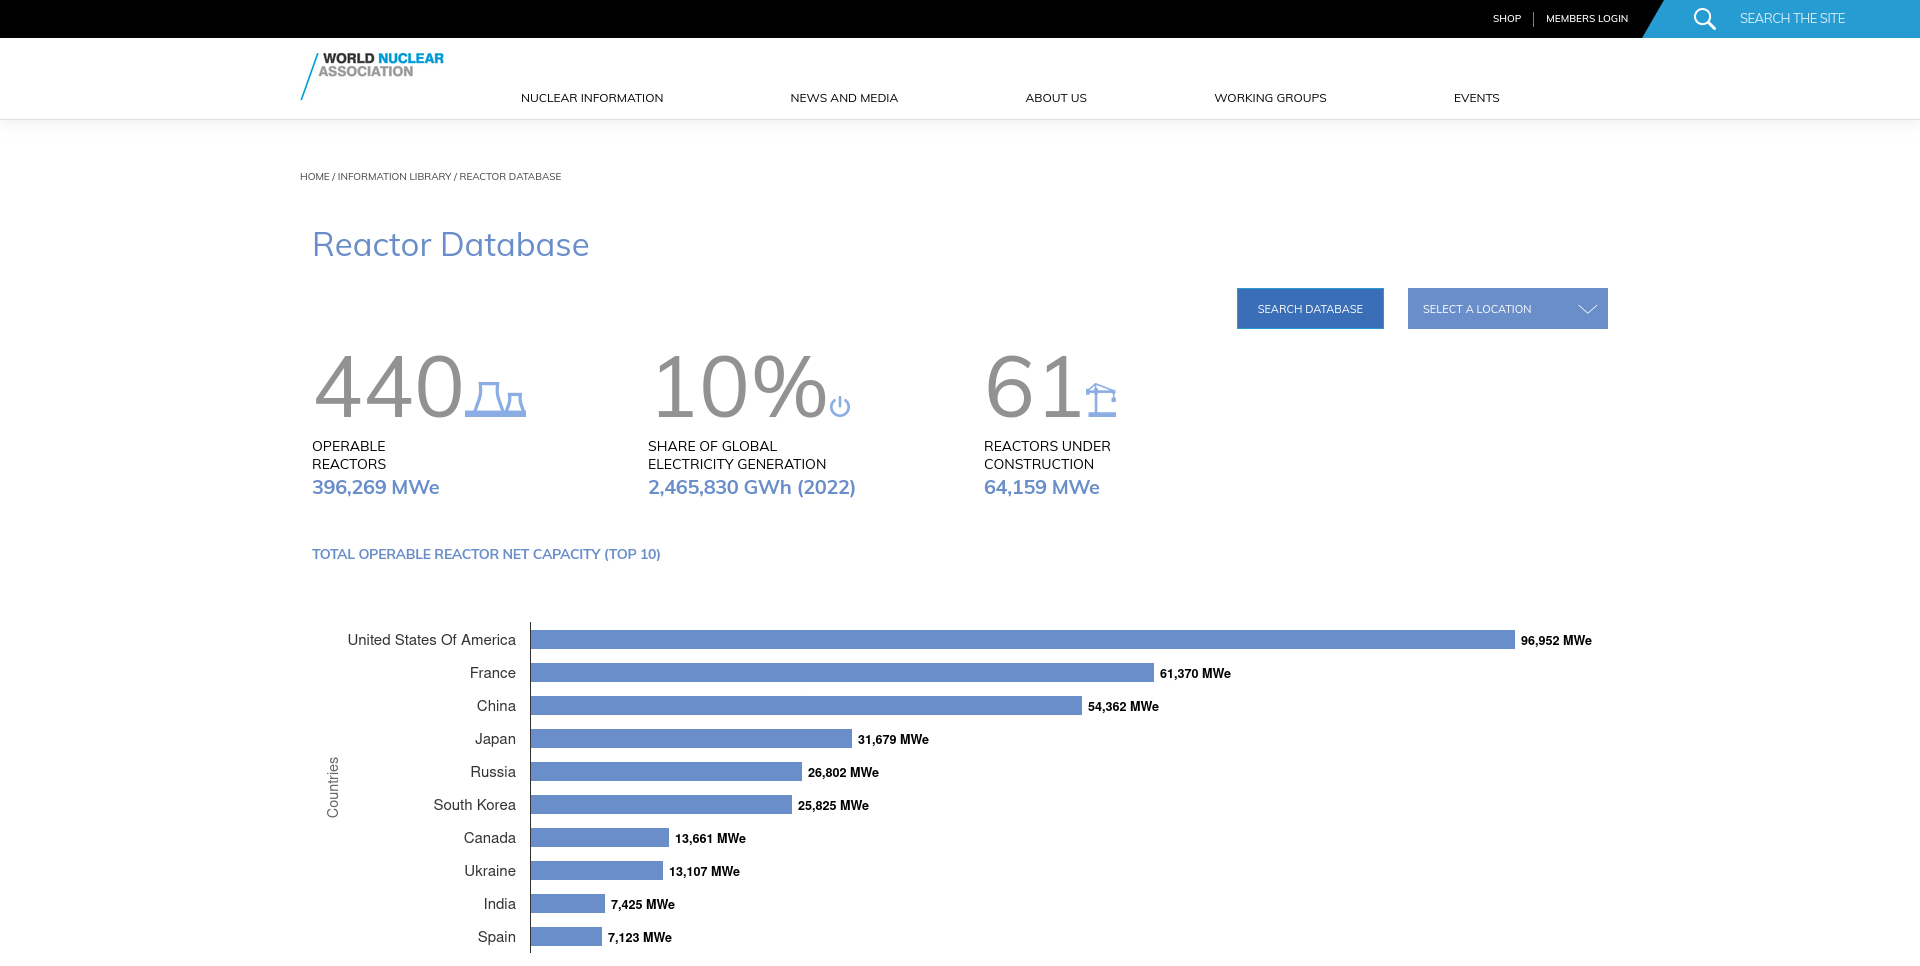
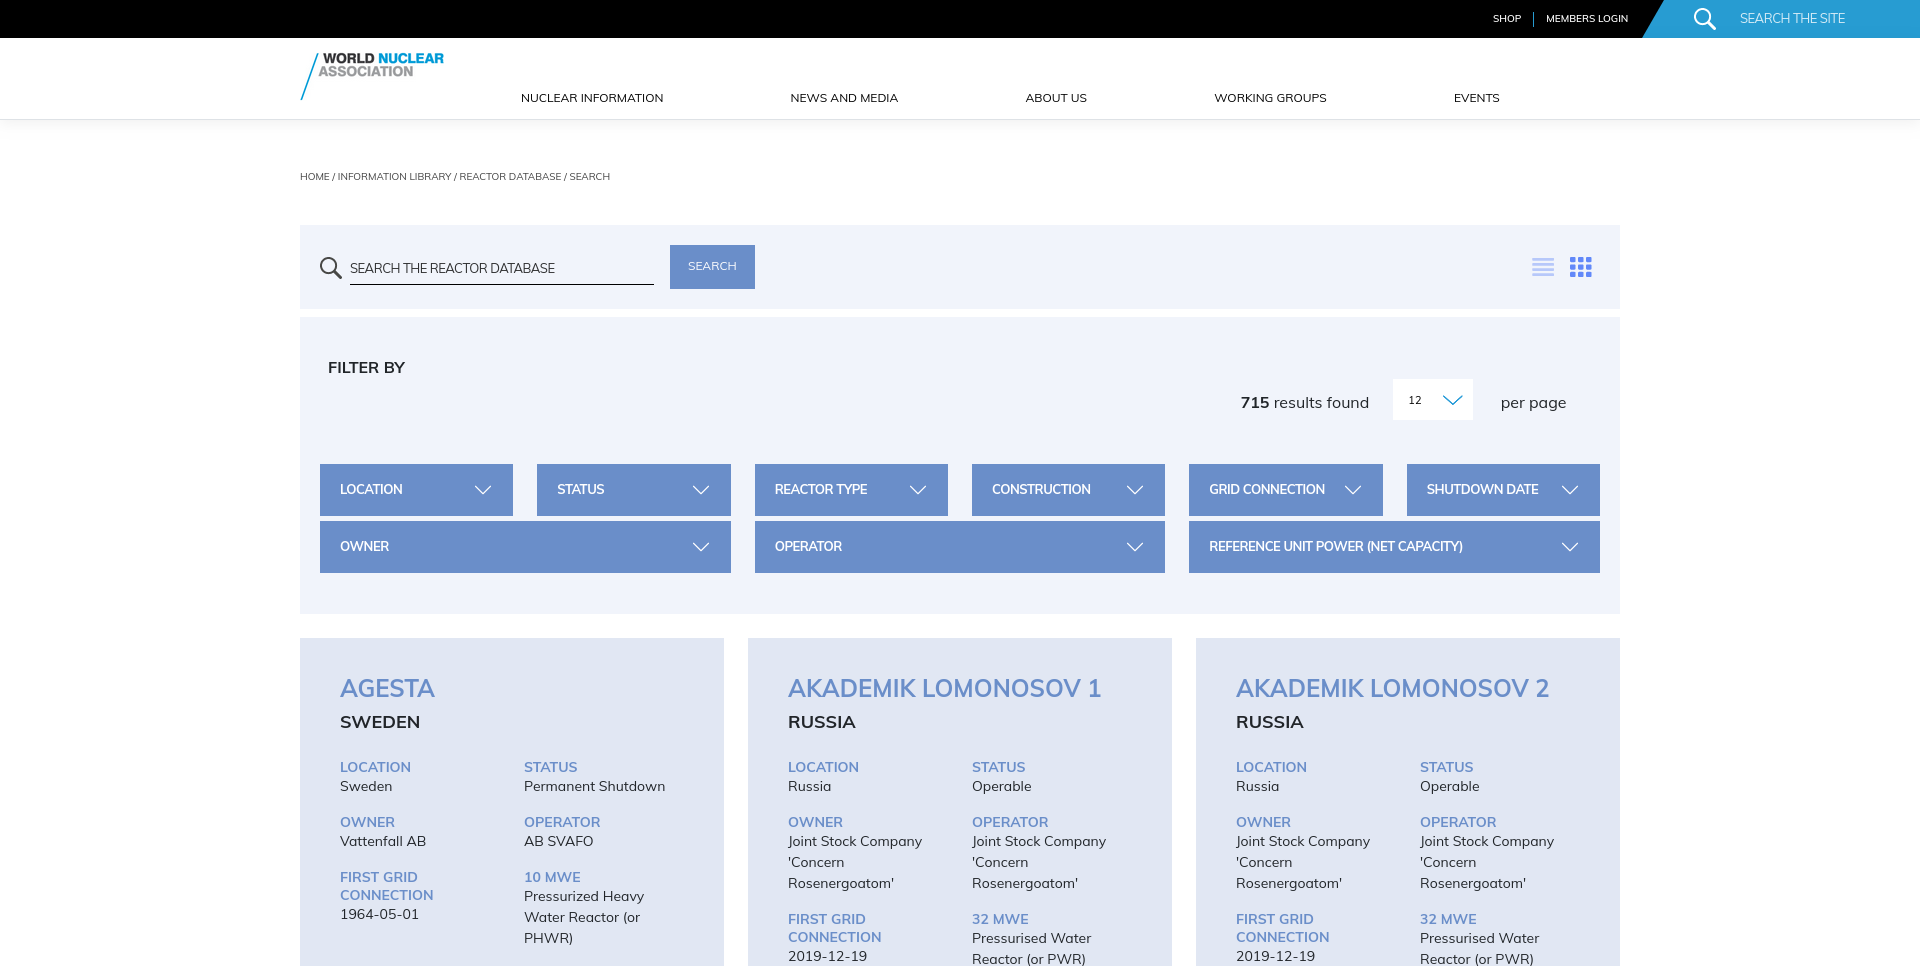
We worked with WNA to design several layers of data visualisation and reporting which would satisfy their three key user classes: the public, journalists, and industry professionals. We designed a data management pipeline which allowed them to continue to manage their reactor and performance data in spreadsheets, and to periodically publish it to visualisations embedded in their commercial CMS. This included a standard search interface, as well as potted reports for individual reactors, entire countries, and arbitrary data selected from search. We also provided a visualisation generator, that would allow WNA administrators to define the parameters of a visualisation, and then embed a code snippet anywhere in their website which would then present live, interactive data in context.


